ALL PROJECTS
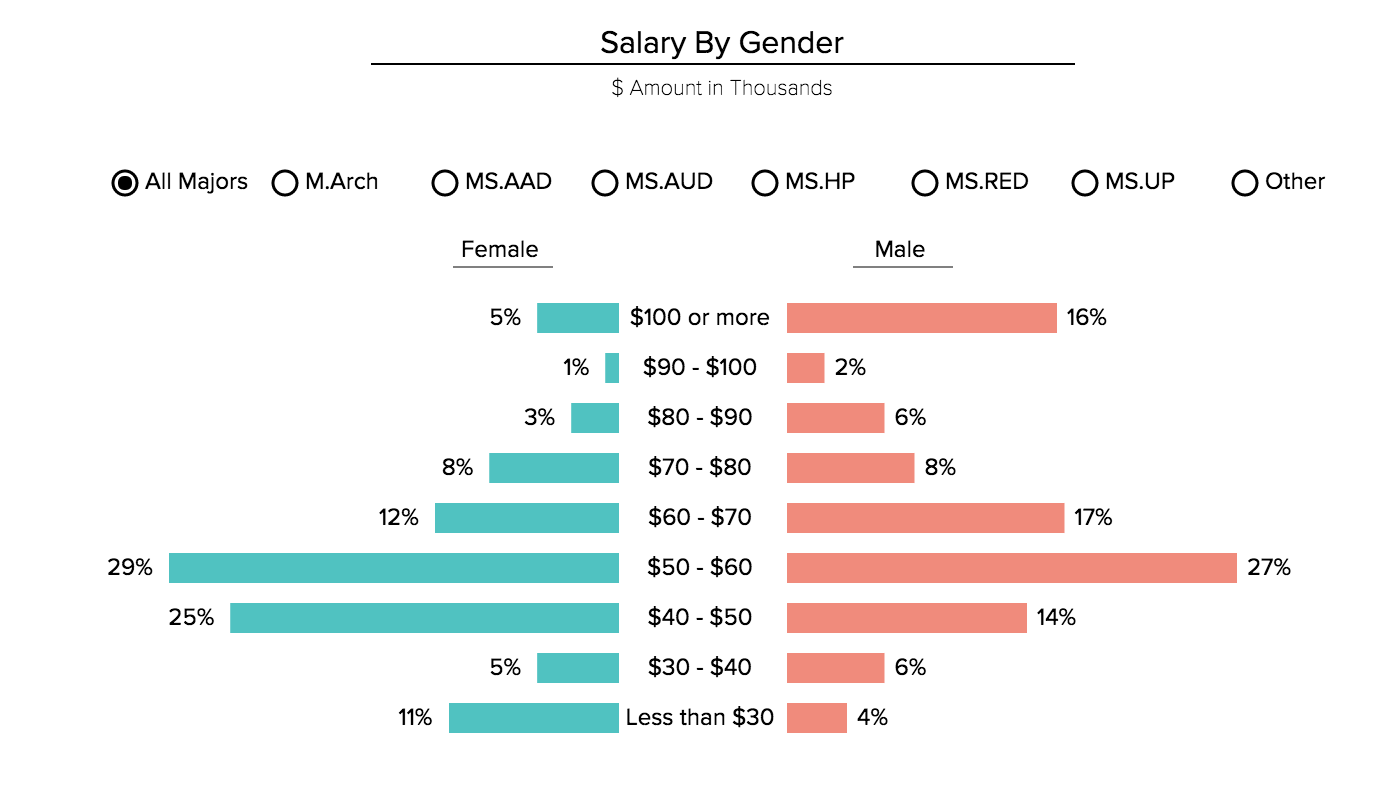
Based on a survey of GSAPP's alumni, this interactive visualization provides insights into the school's professions and helps record the different paths its graduates have taken.
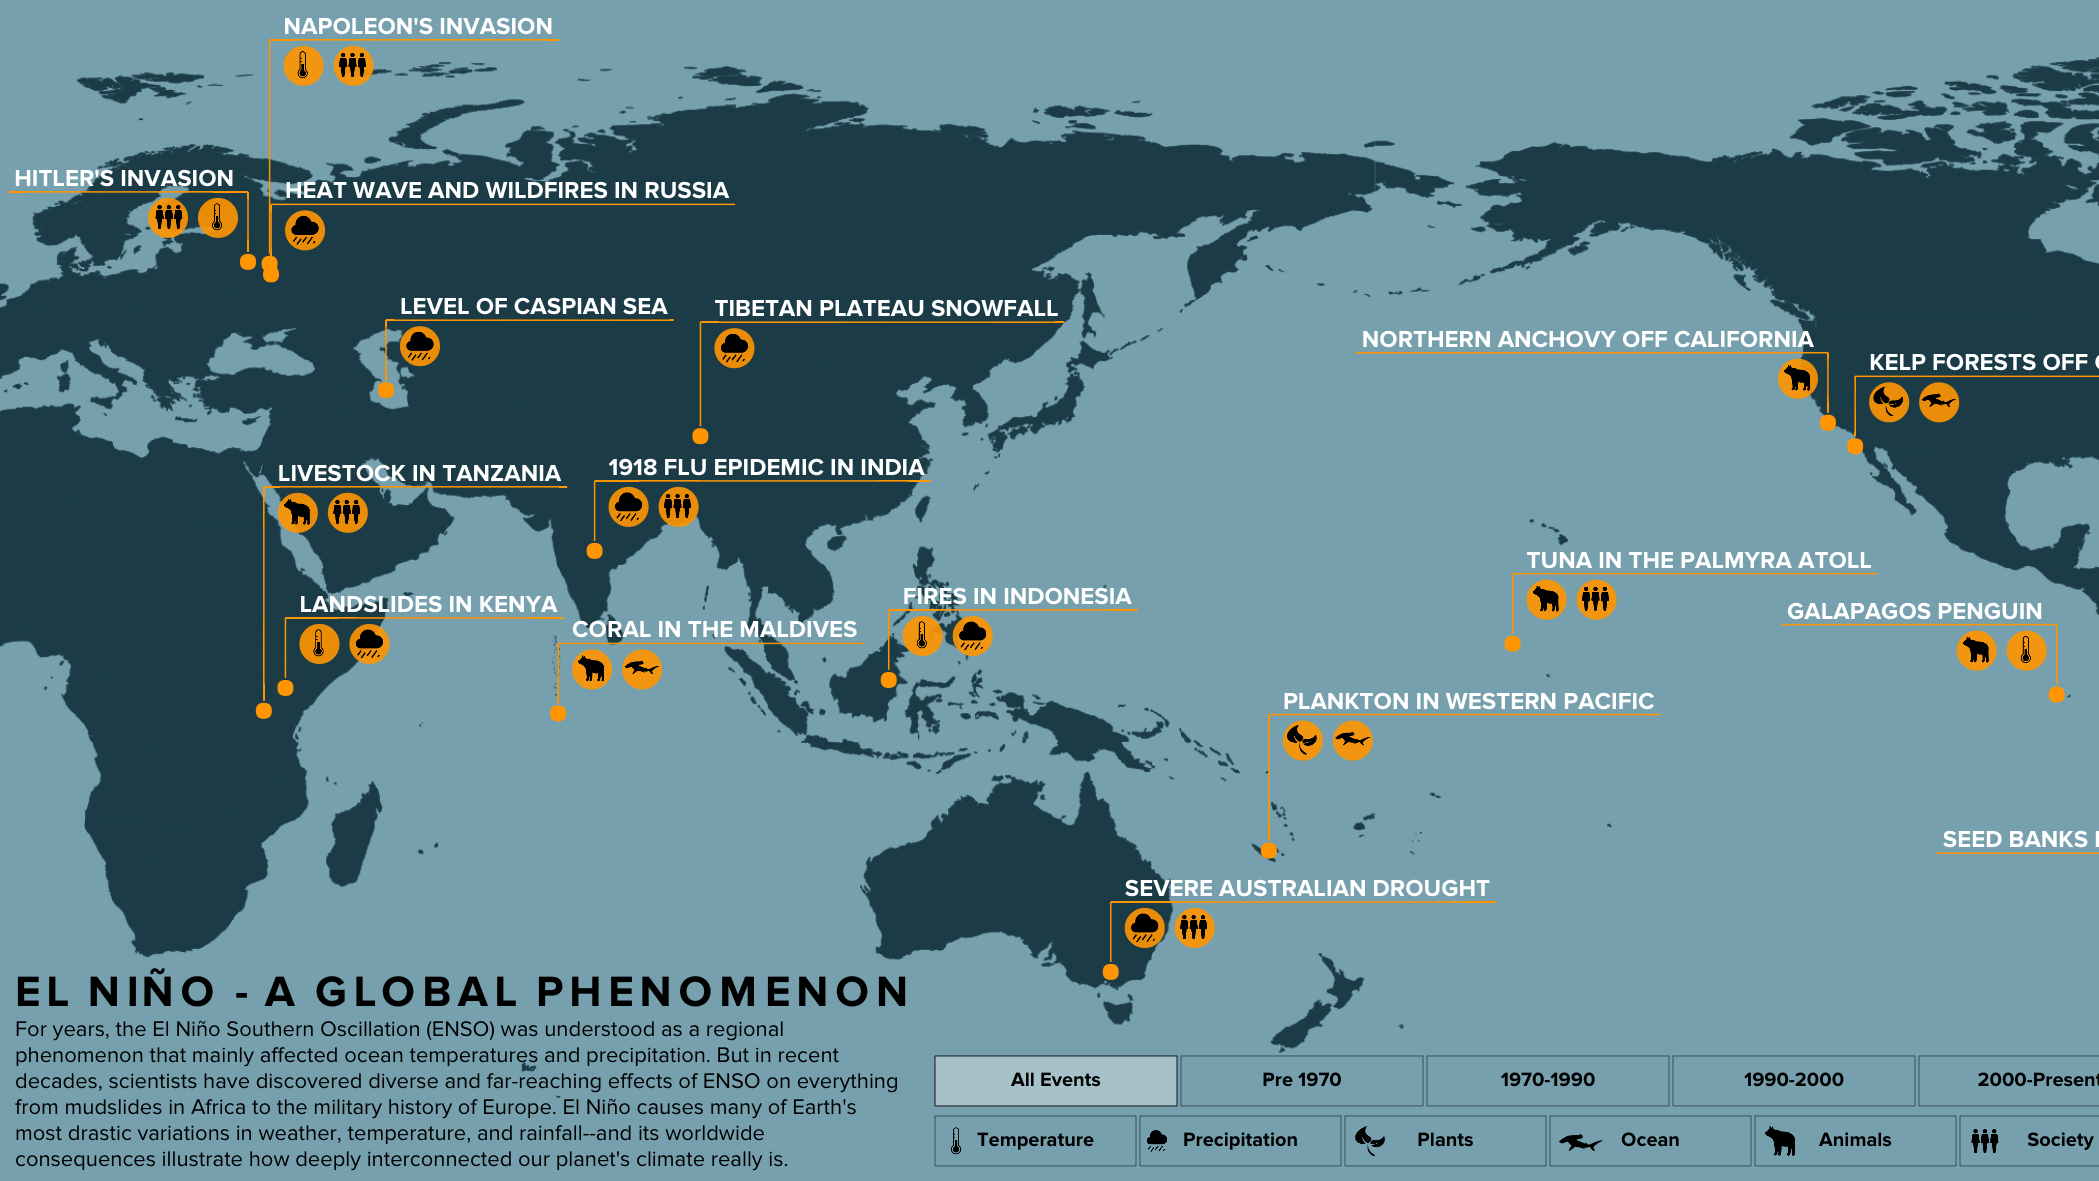
An interactive map of climate change showing multiple El Niño related events around the world and throughout history. This map illustrates the global reach of El Niño.
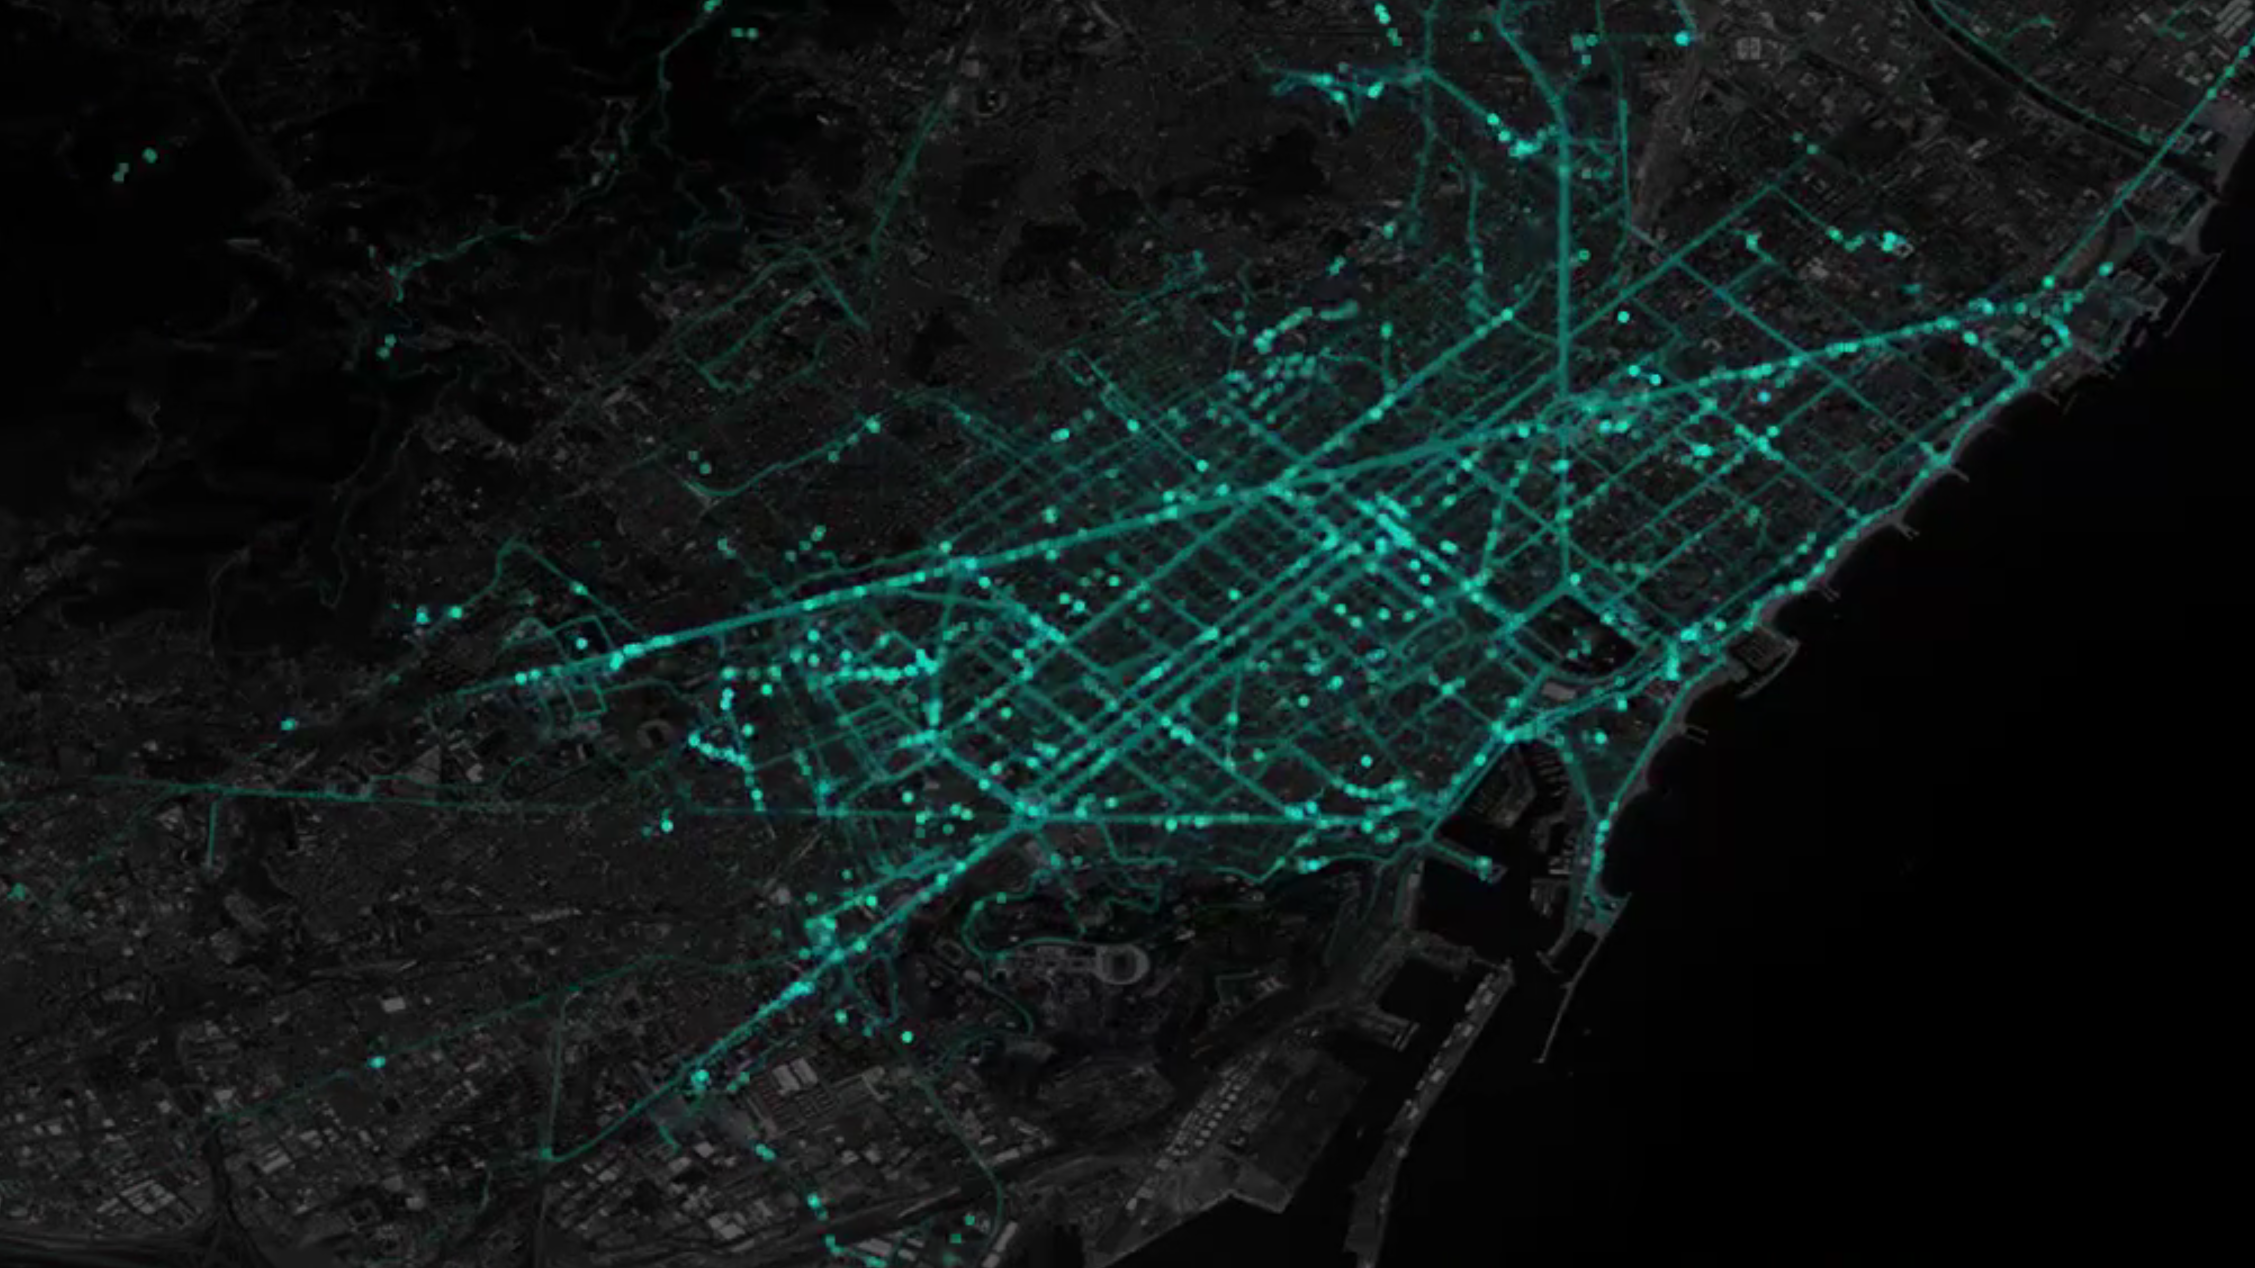
Built for 'Play to Ride', this animation visualizes all the bike rides taken during the Barcelona Cycle Challenge - 2014, and illuminates the city's great biking activity.
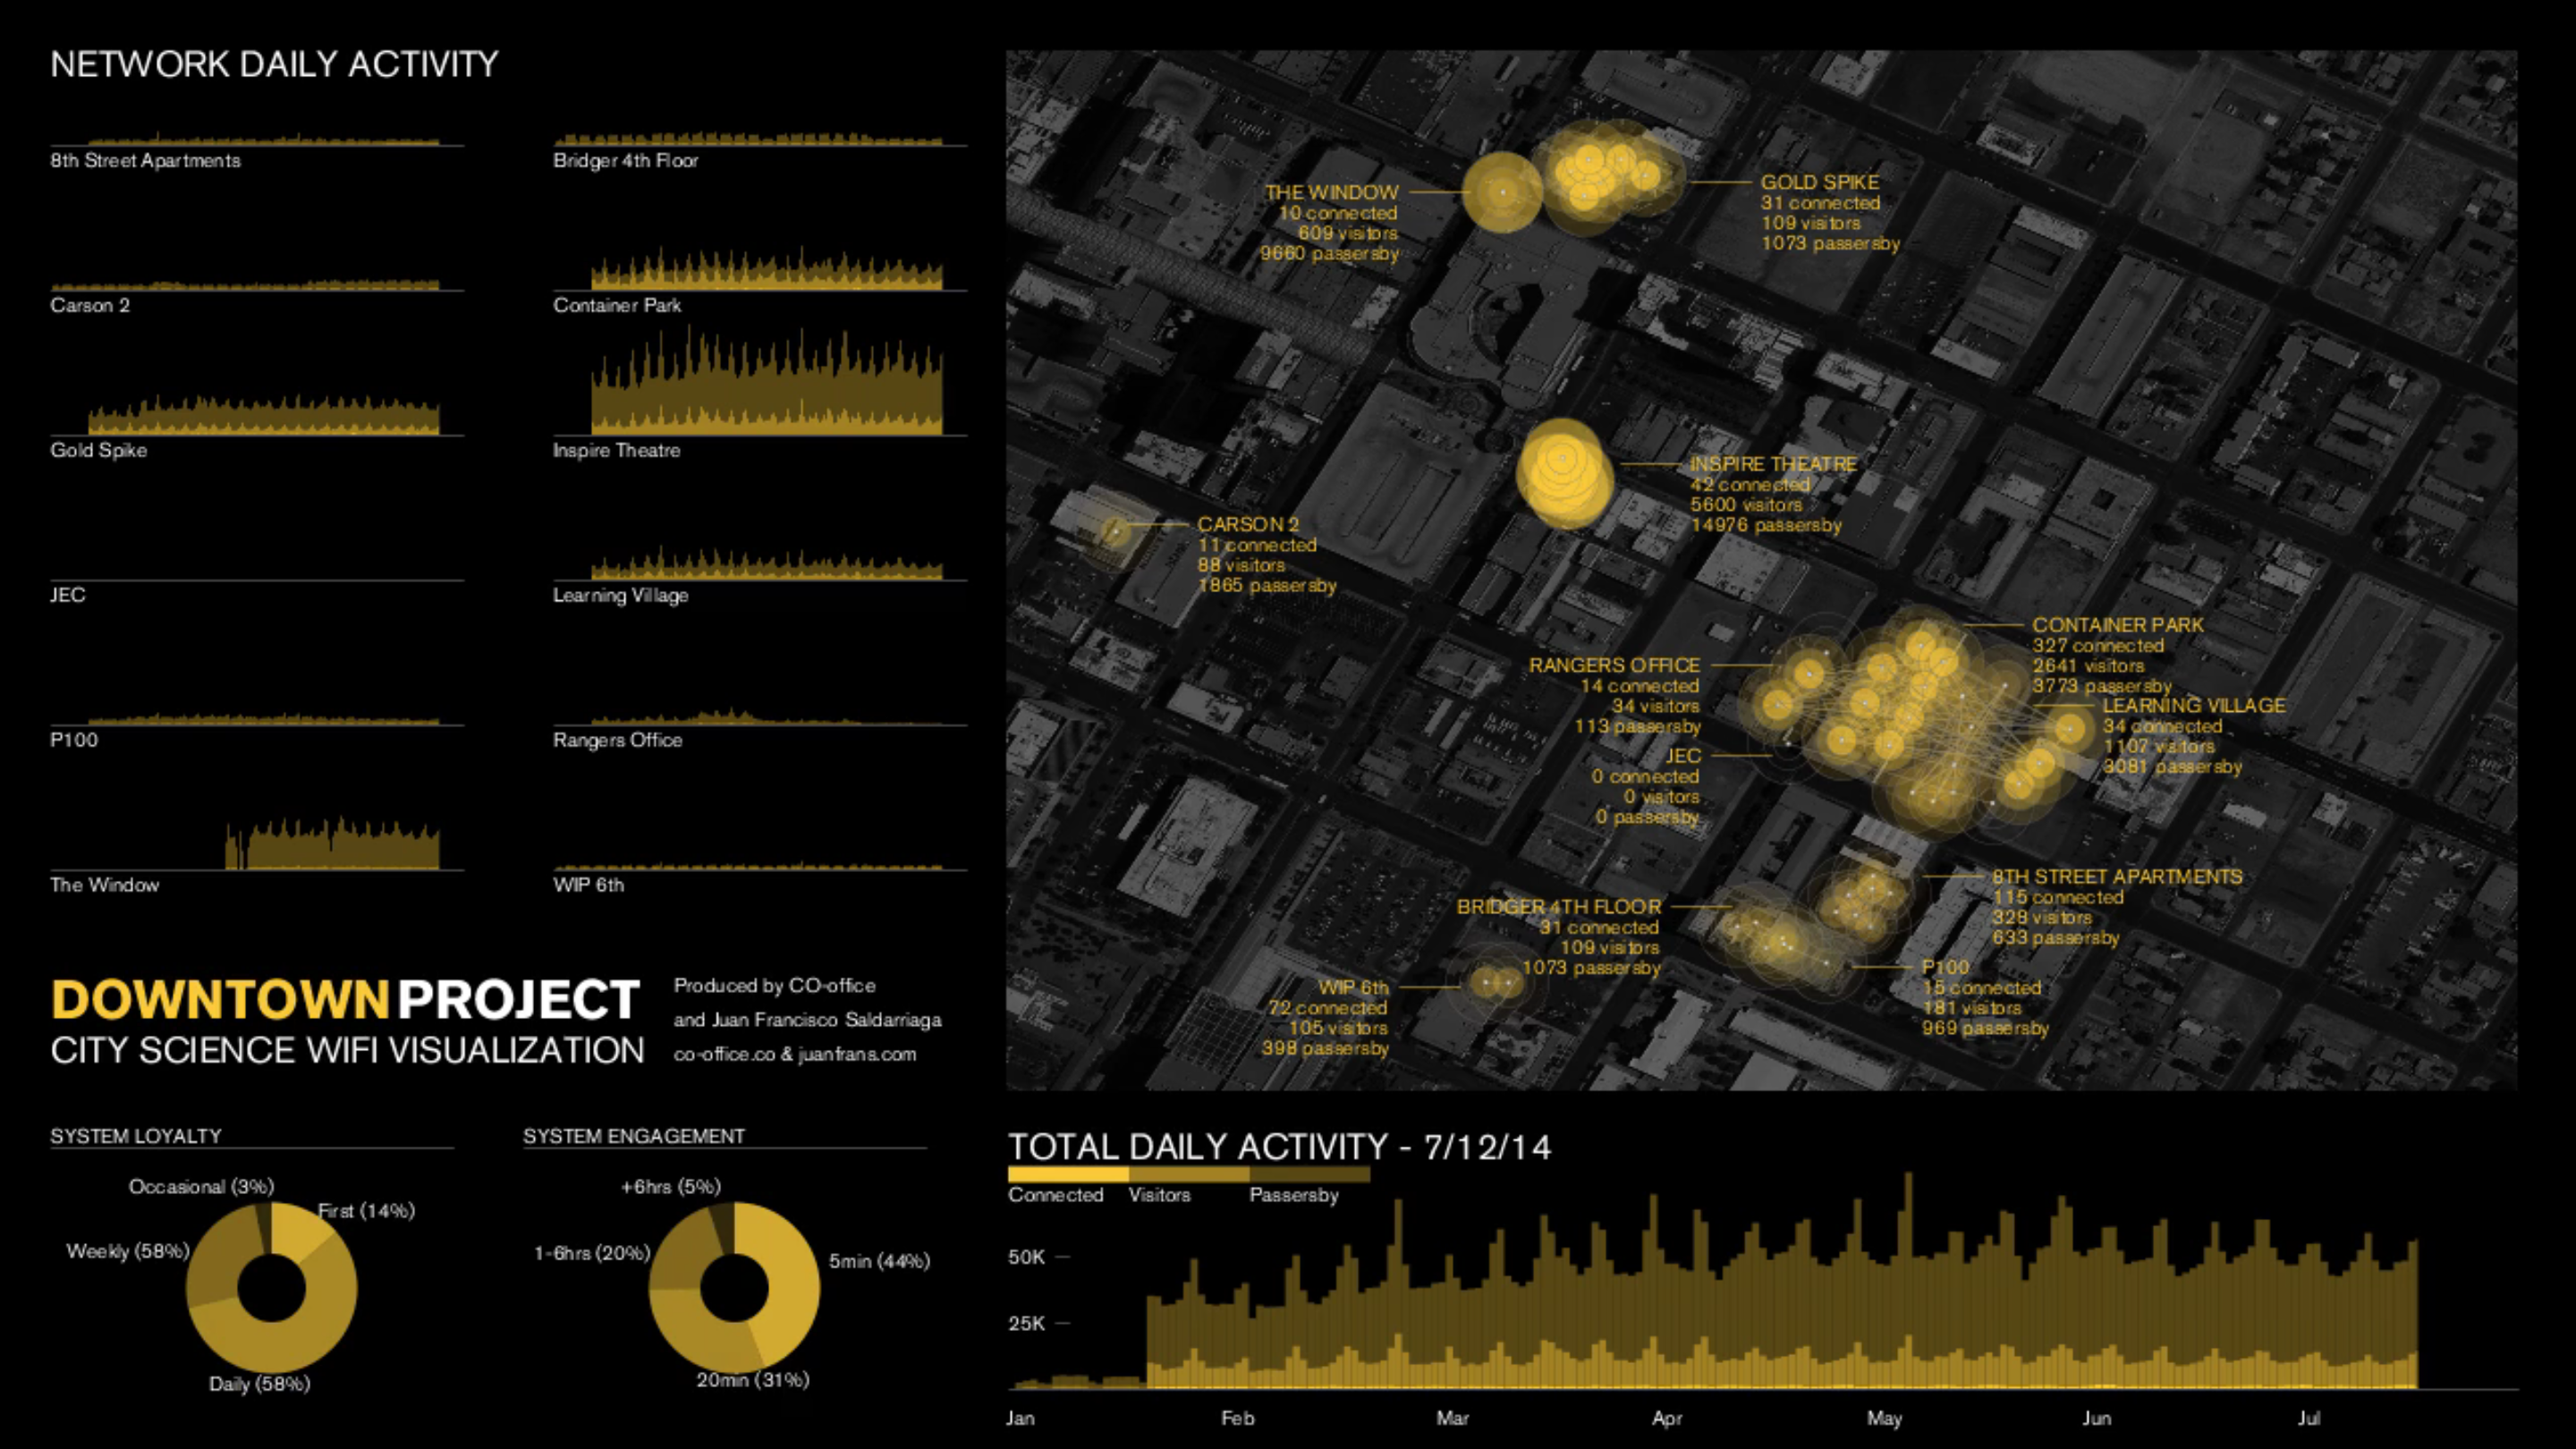
A short animation that visualizes public activity around Science City. Based on wifi access data, it charts the increasing number of people moving and working in downtown Vegas.
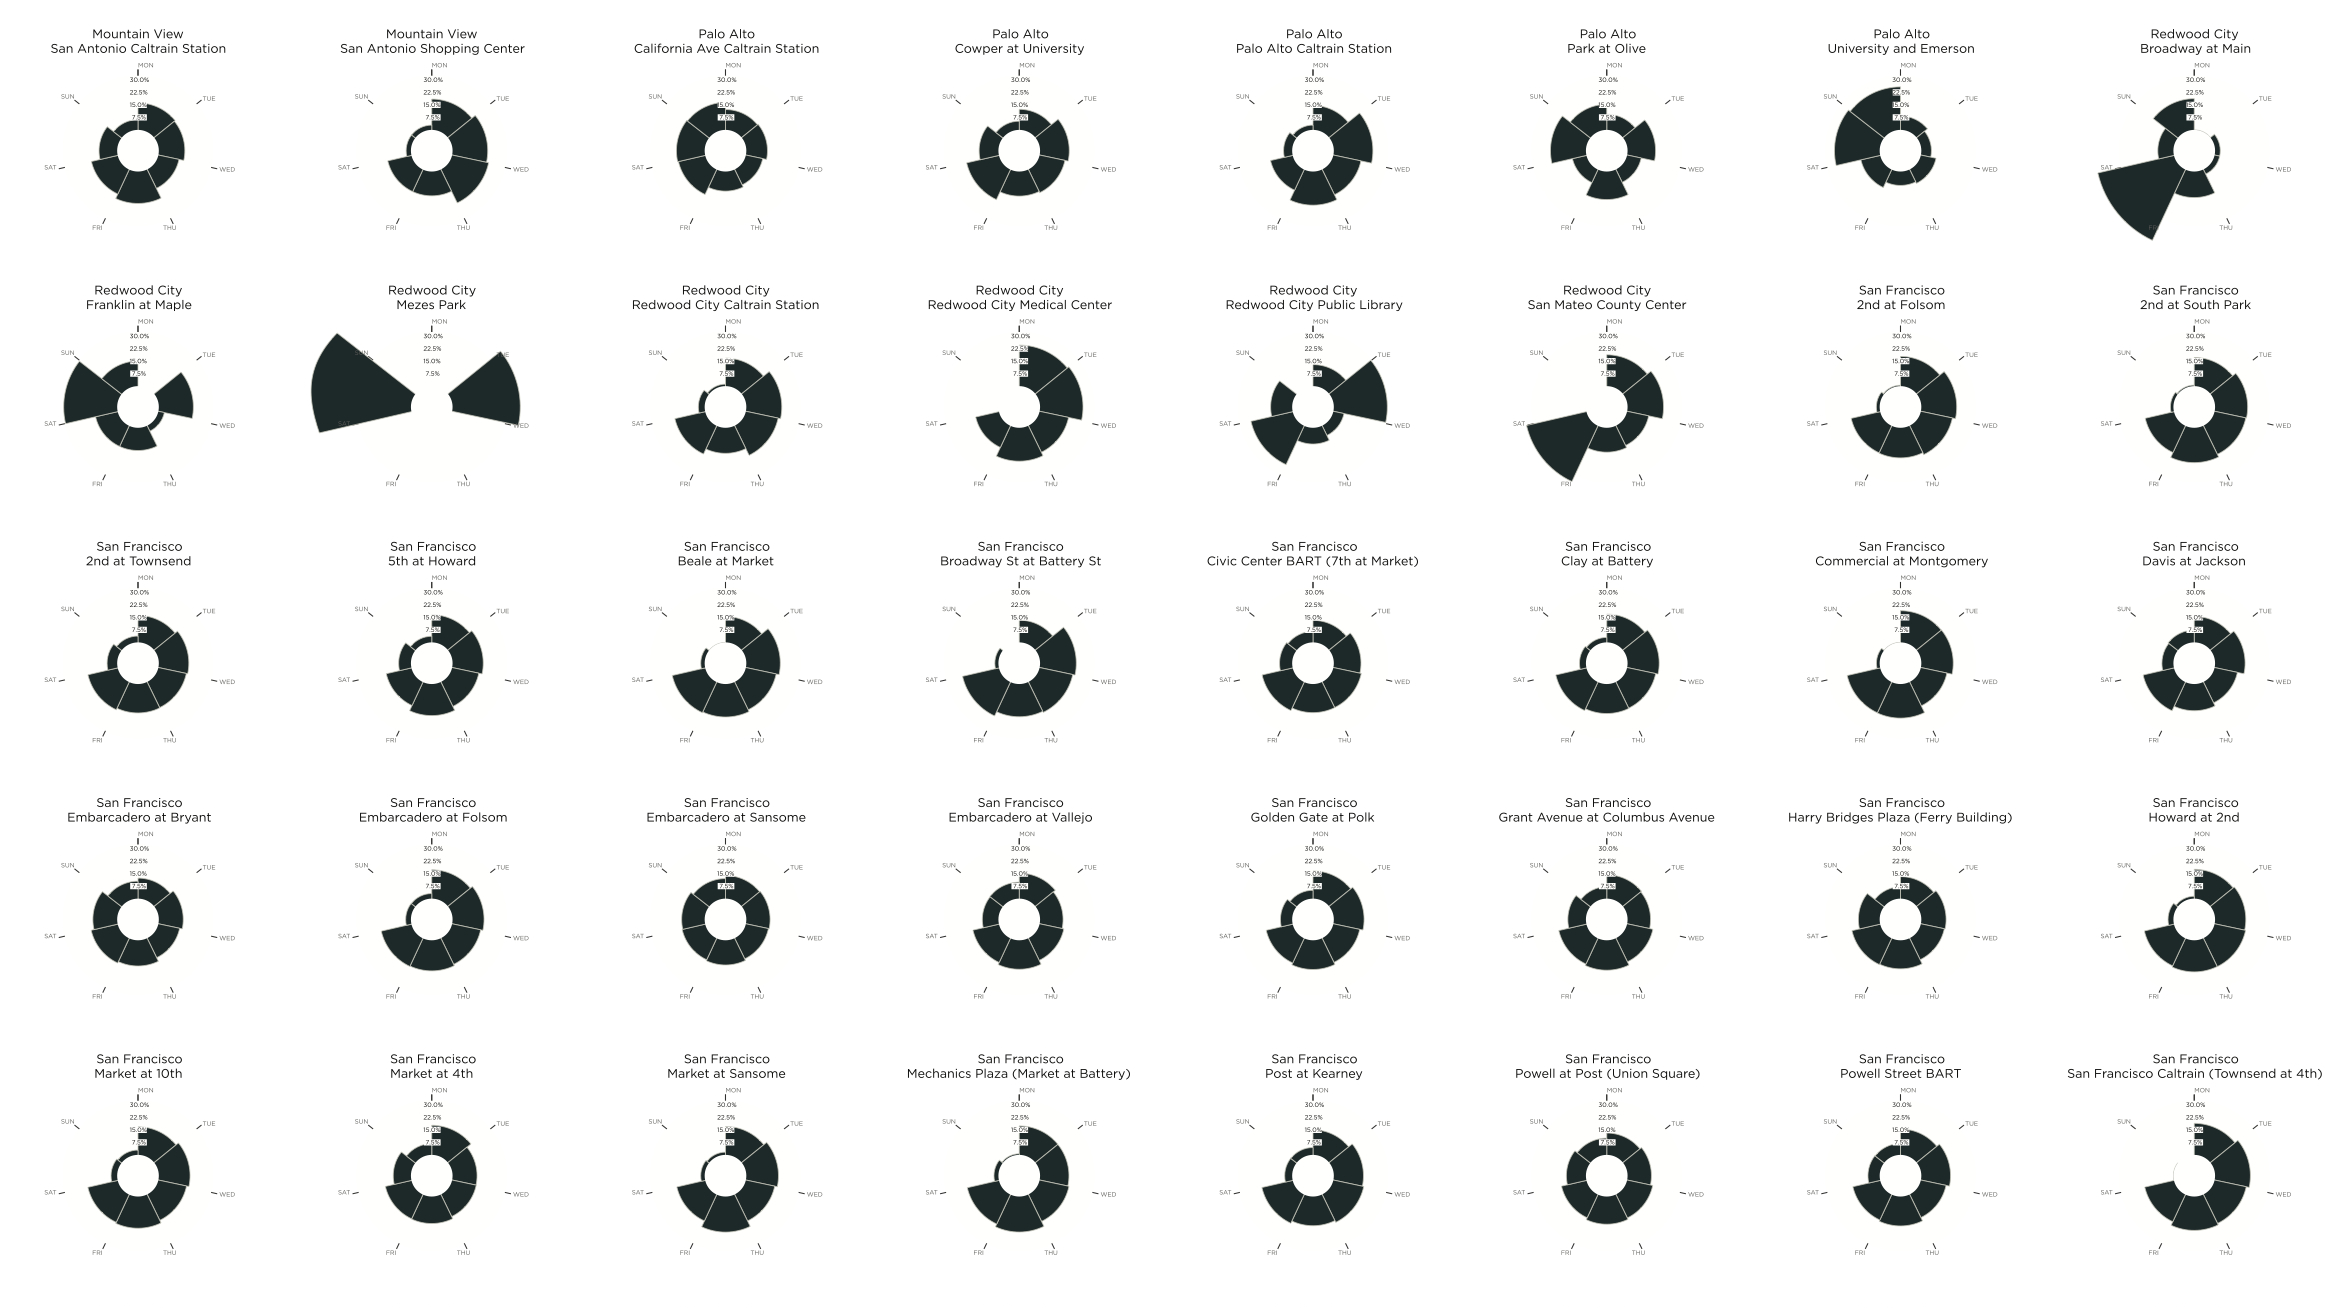
These minimal vignettes describe the activity around each station in the Bay Area Bike Share system and beautifully illustrate the diversity of the system.
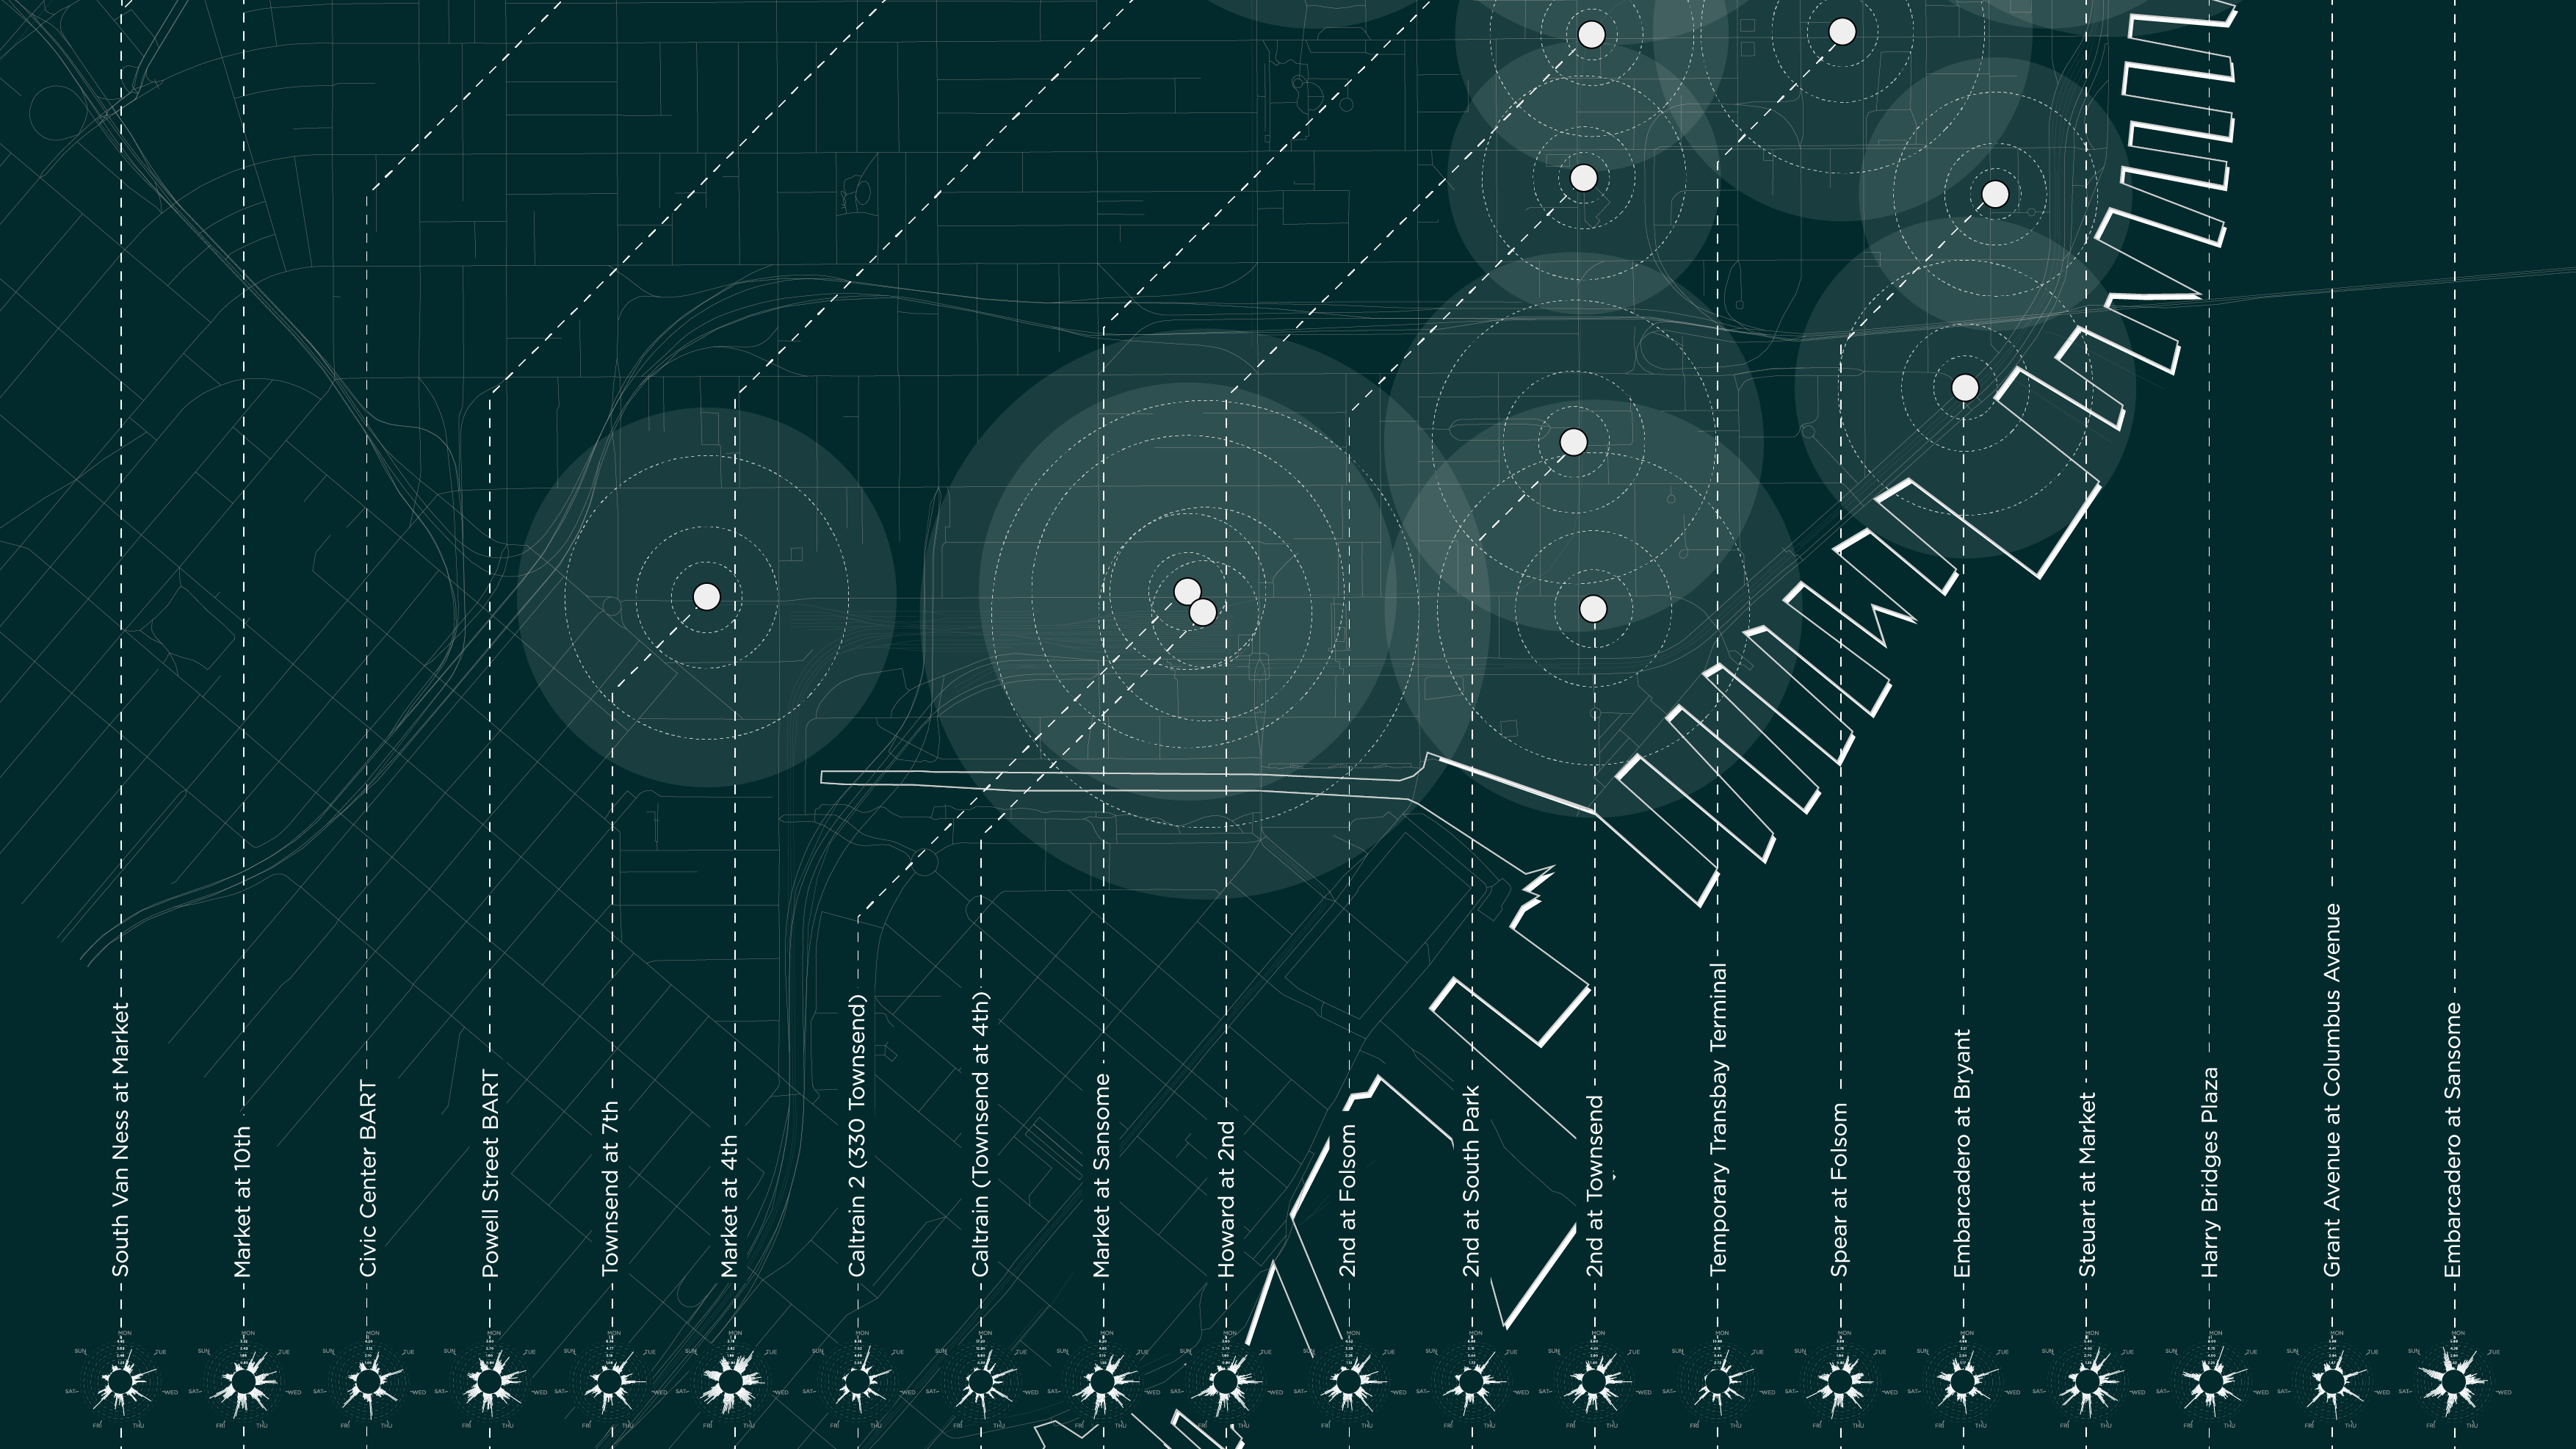
Originally produced for a data visualization competition this updated version of our submission maps bike share activity around San Francisco.
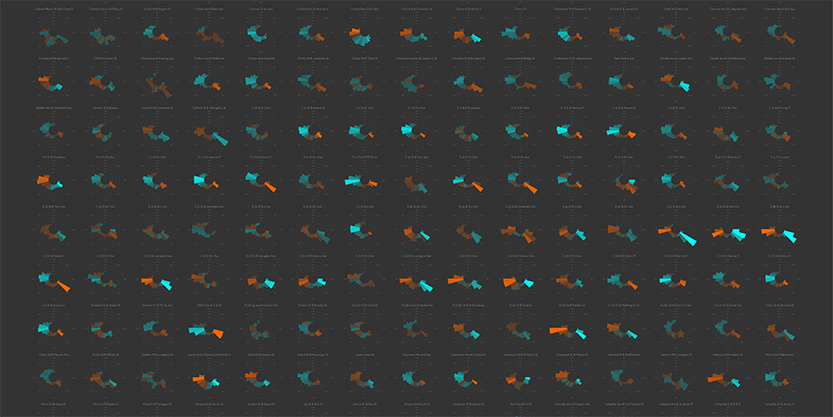
A visual exploration of New York City's Citibike usage patterns, specially centered on its rebalancing issues.