AR FOR EVERYONE! EXPERIENCING AUGMENTED REALITY NEWS STORIES IN THE BROWSER
Visit the Virtual Tour of the Businesses that Closed due to COVID-19 in New York City websiteAR For Everyone! was produced at The Brown Institute for Media Innovation with support from an ONA’s Journalism 360 grant. Its team was Ziv Schneider, Juan Francisco Saldarriaga, and Sukanya Aneja.
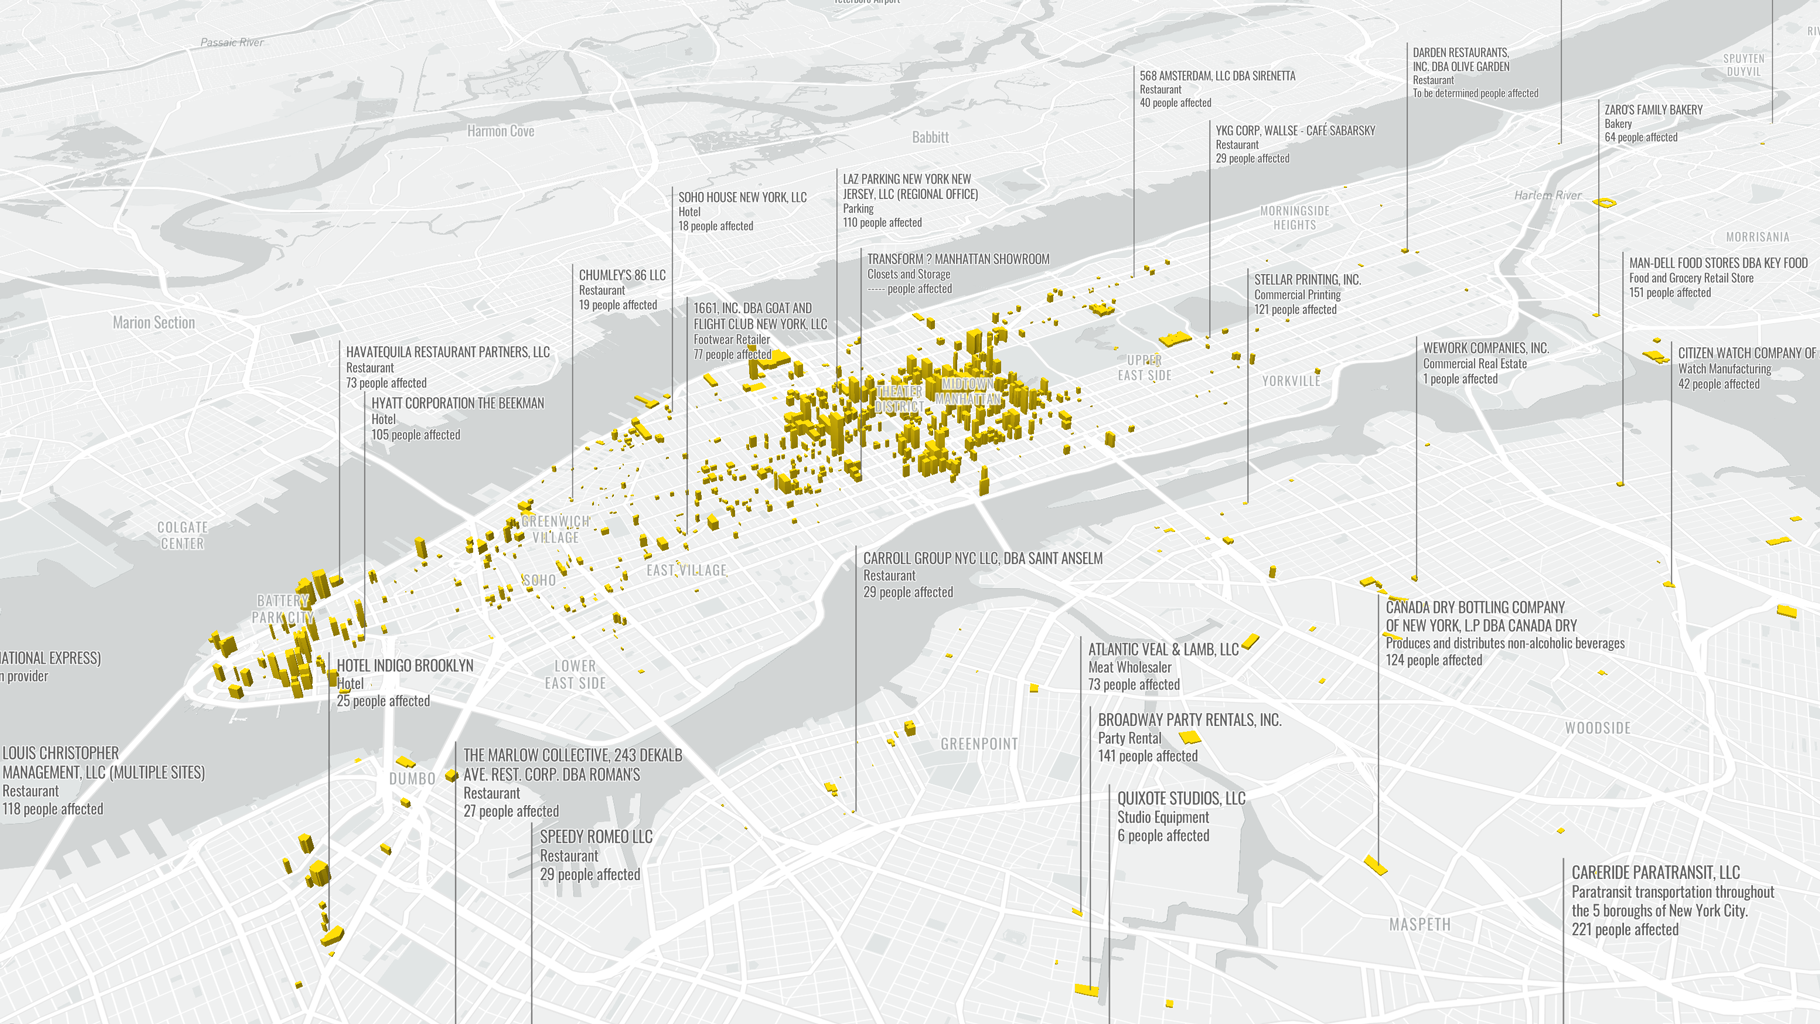
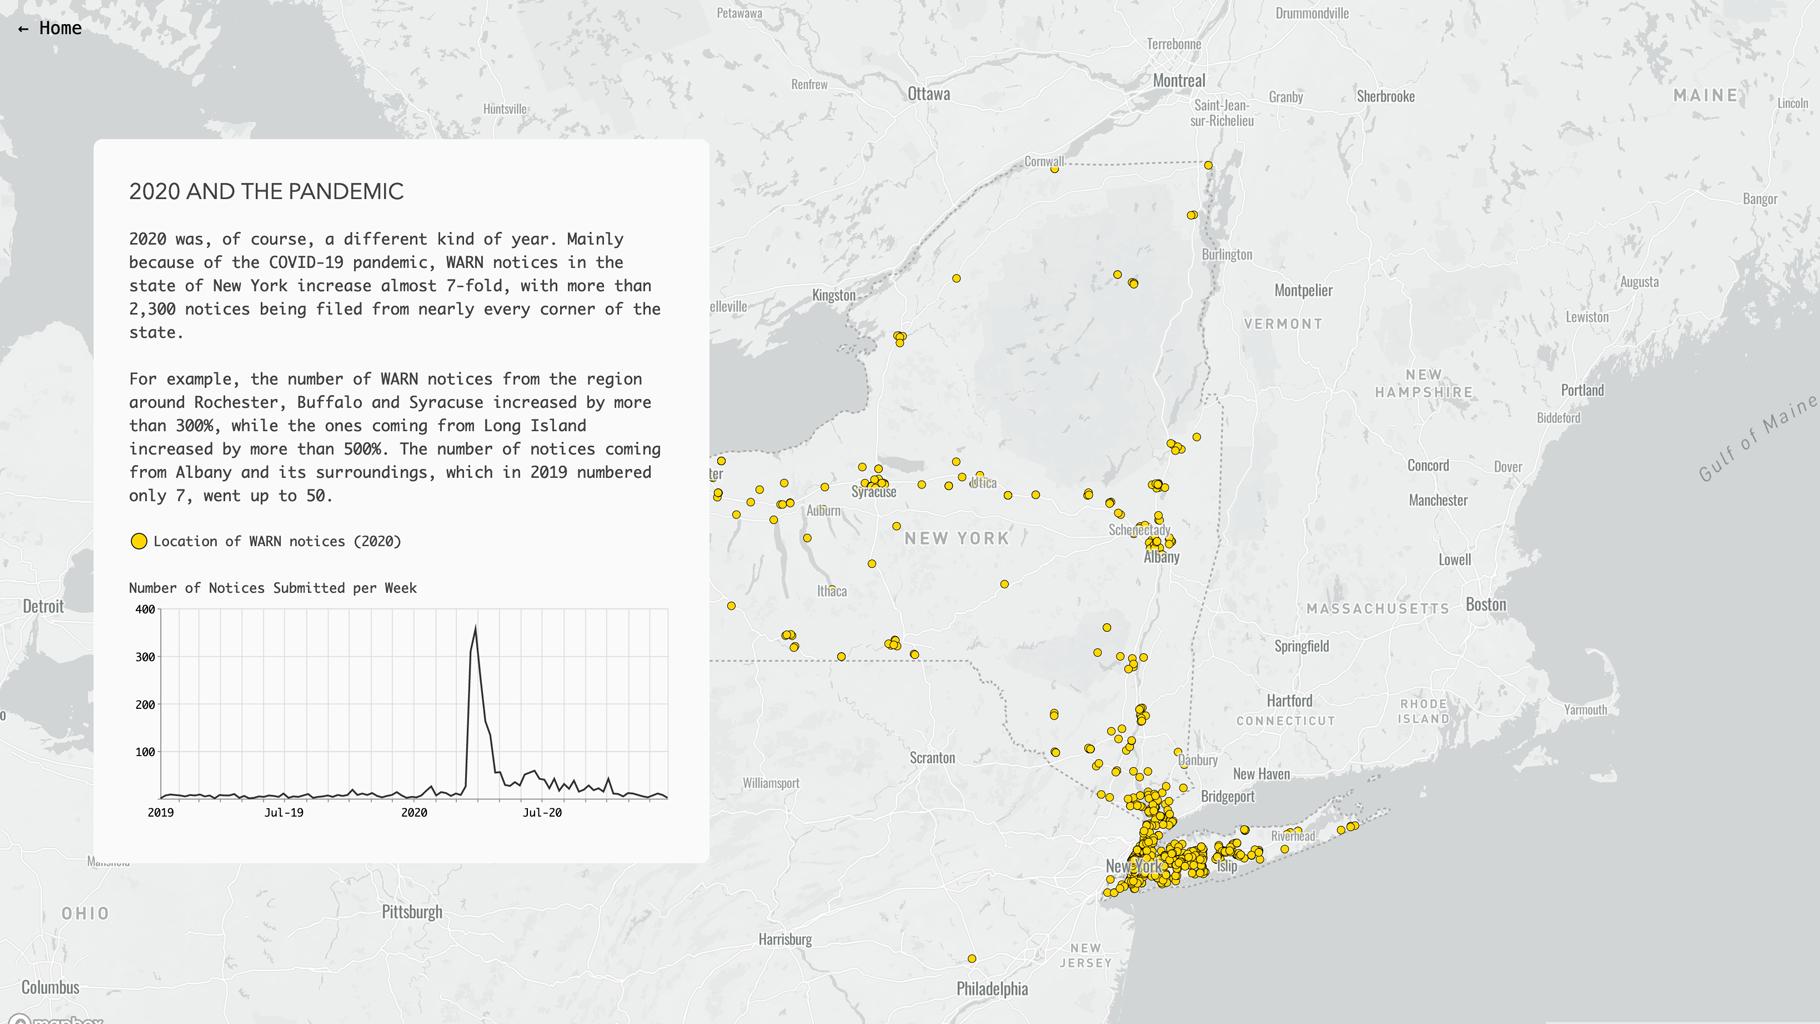
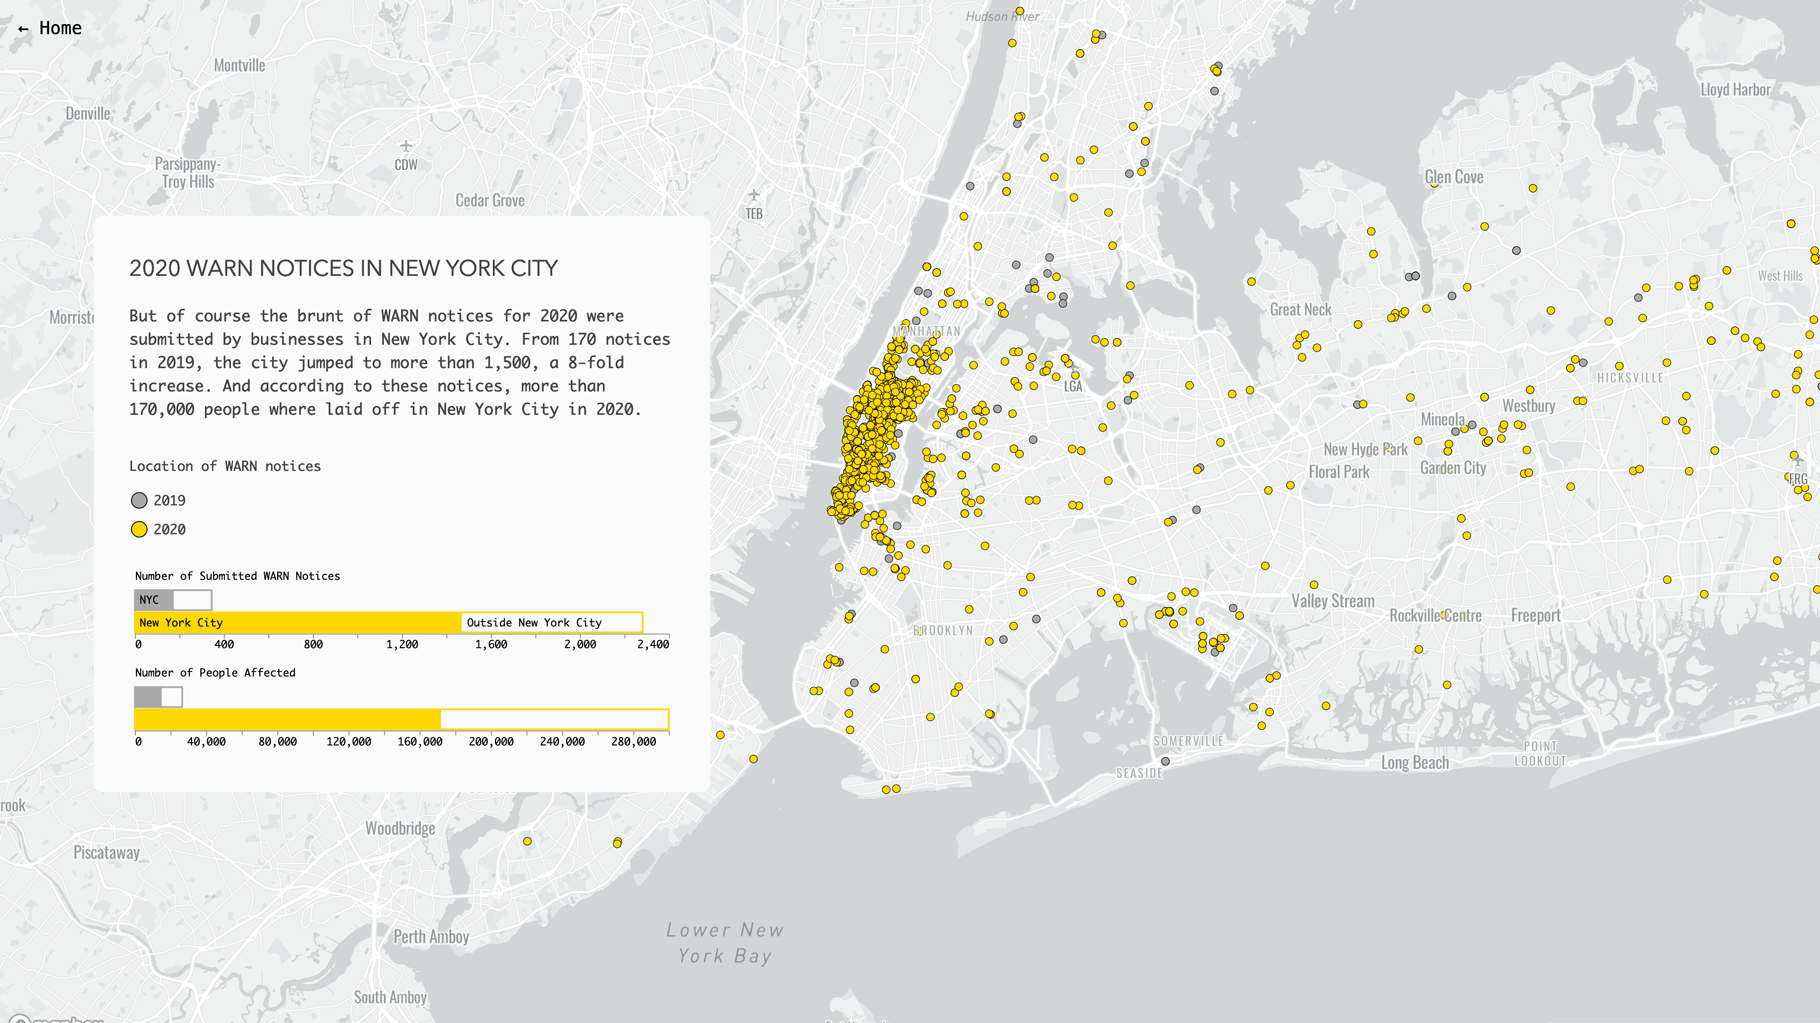
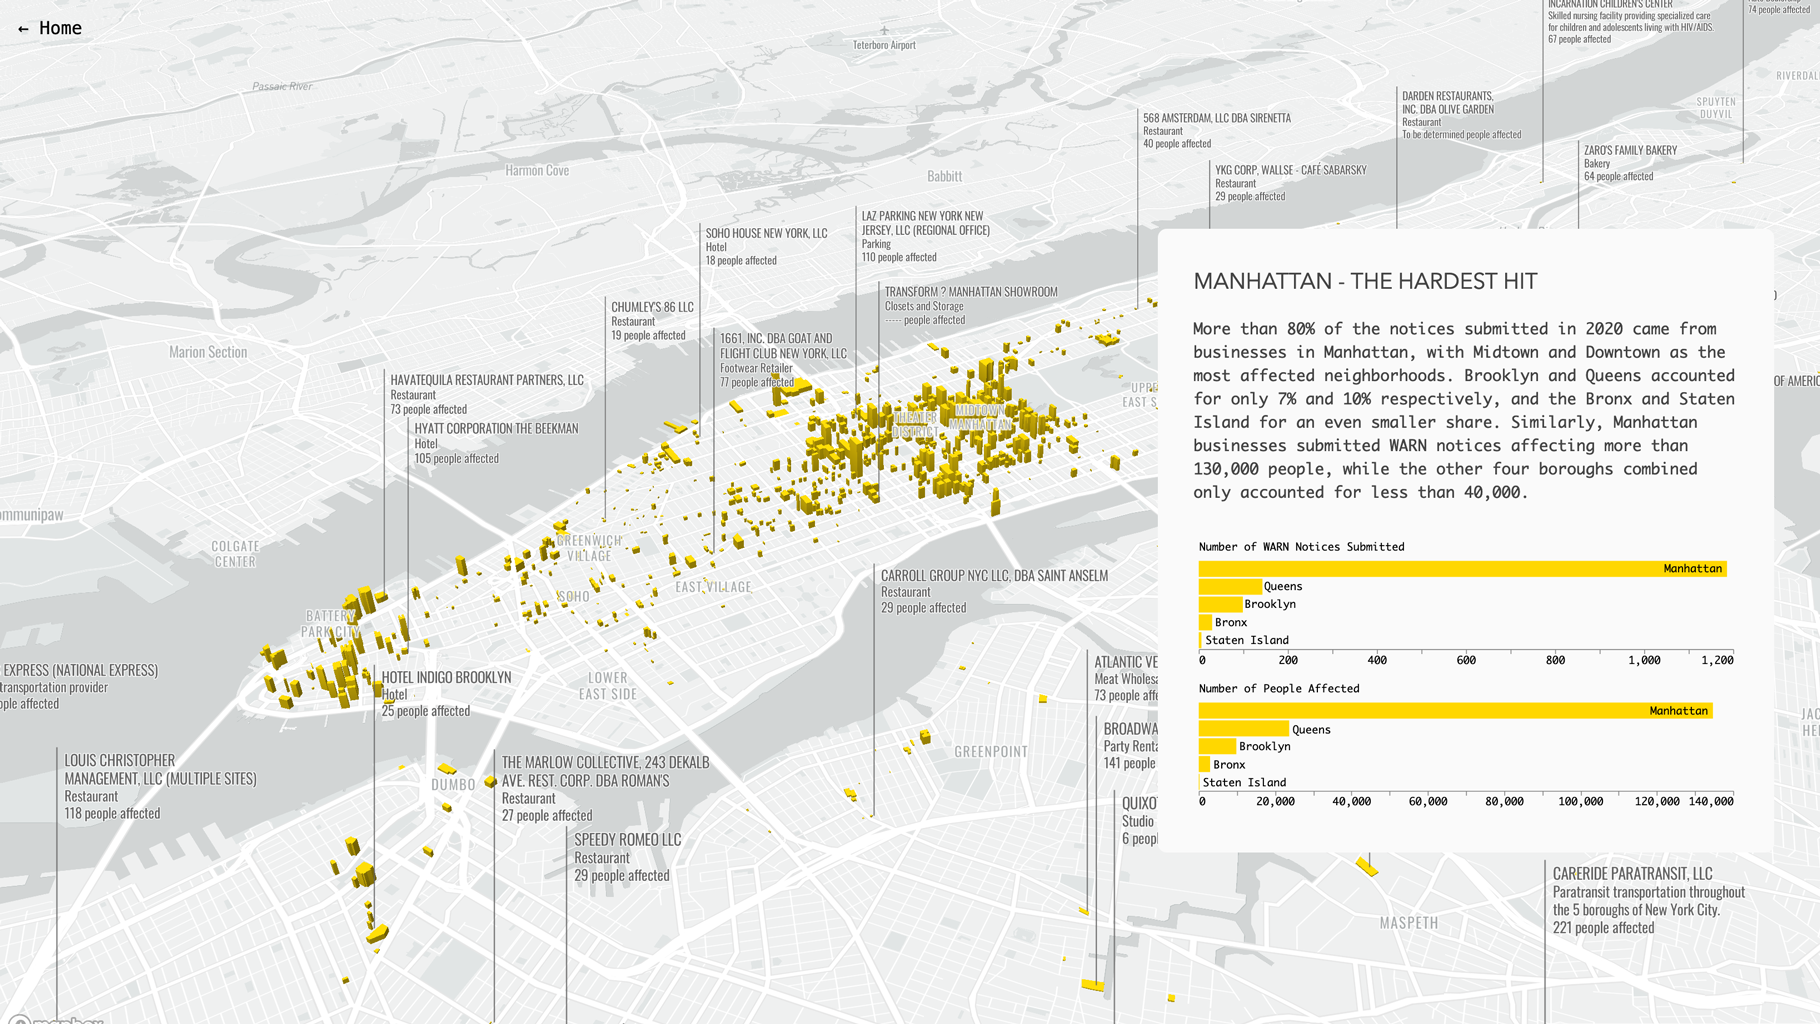
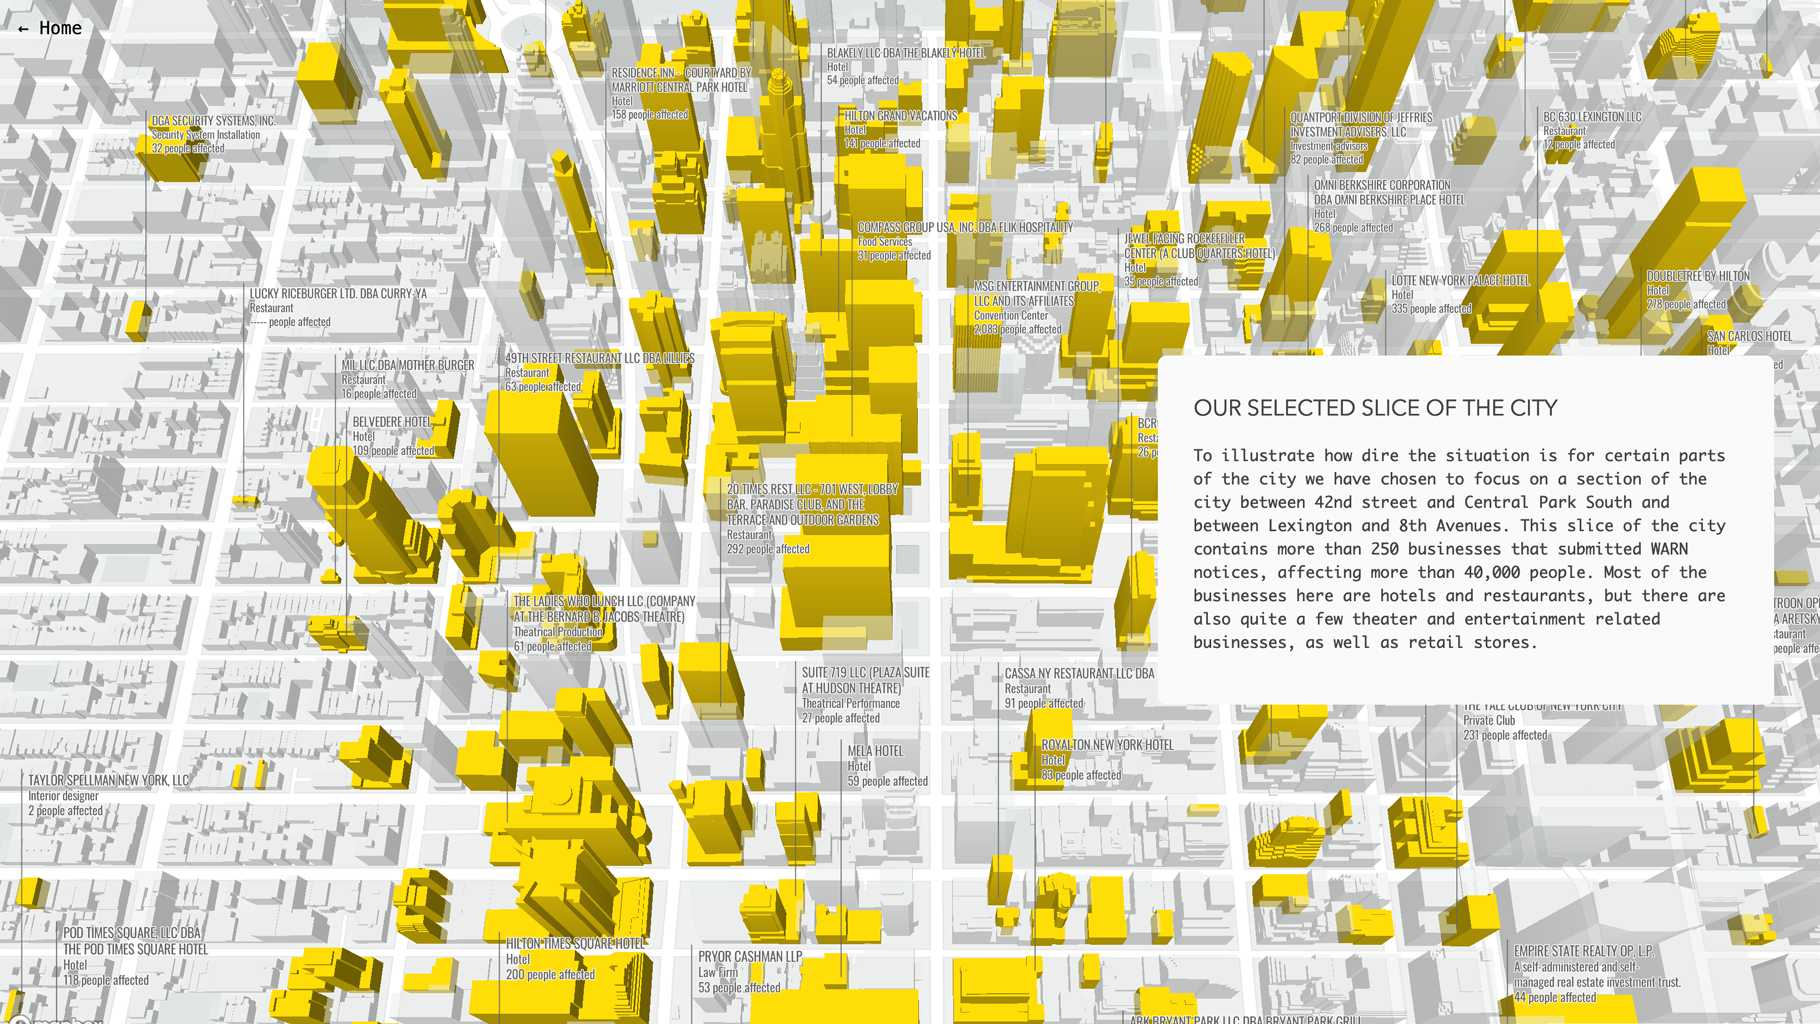
As part of the AR For Everyone! project we built a story map analyzing and visualizing the toll of the COVID-19 pandemic on businesses in New York State and New York City. For our base dataset we scraped New York State’s Worker Adjustment and Retaining Notification database and we analyzed it using Python. Using Mapbox’s storytelling template, we then created this walk through taking the viewer from the state level, to New York City, to a specific section of Midtown Manhattan, and then letting them explore its 3D model in augmented reality.
Here are some screenshots from the story:
AR For Everyone! was built with Mapbox and Google’s Model Viewer. View the project’s code on Github